Analytics
The Analytics page provides four tabs for reviewing and exporting your time data: Summary, Detailed, Exports, and Schedules.
Summary
Section titled “Summary”The Summary tab displays visual charts that give you a high-level overview of where your time goes.
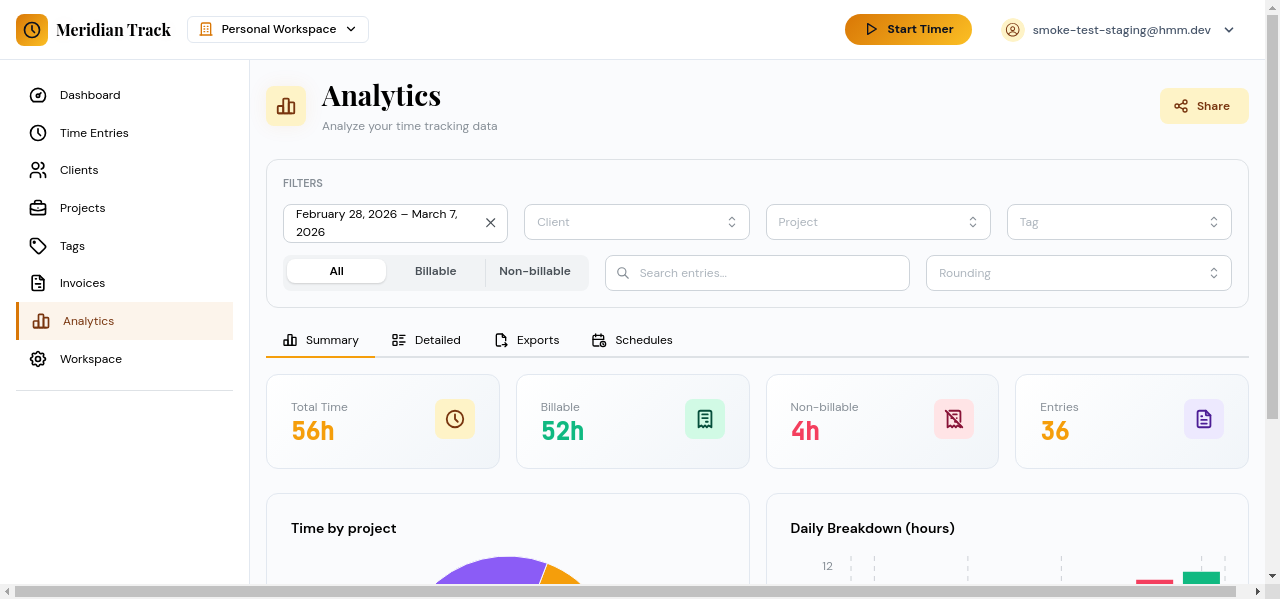
Available charts include:
- Hours by project — see which projects consume the most time.
- Hours by client — compare time spent across clients.
- Hours by day — view daily patterns over the selected period.
Use the date range picker at the top to adjust the reporting window. All charts update to reflect the chosen range.
Detailed
Section titled “Detailed”The Detailed tab presents a tabular breakdown of time entries.
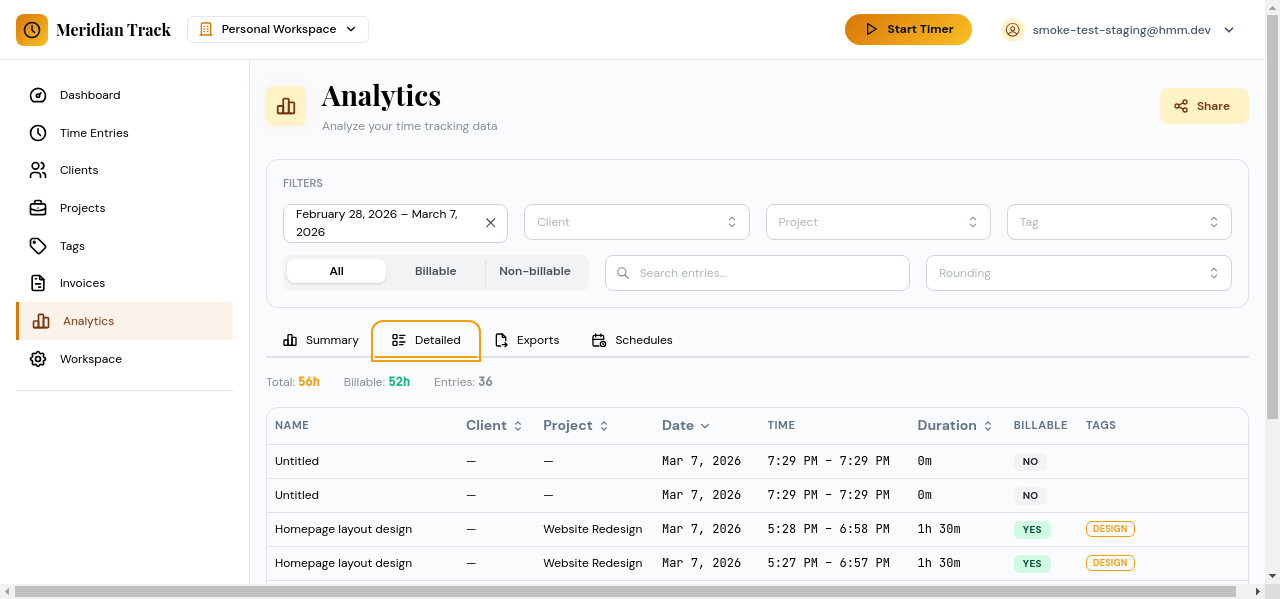
You can filter the table by:
- Date range
- Client
- Project
- Tags
- Billable status
The table shows individual entries with their duration, project, client, and tags, making it easy to audit specific periods.
Exports
Section titled “Exports”The Exports tab lets you generate downloadable reports.
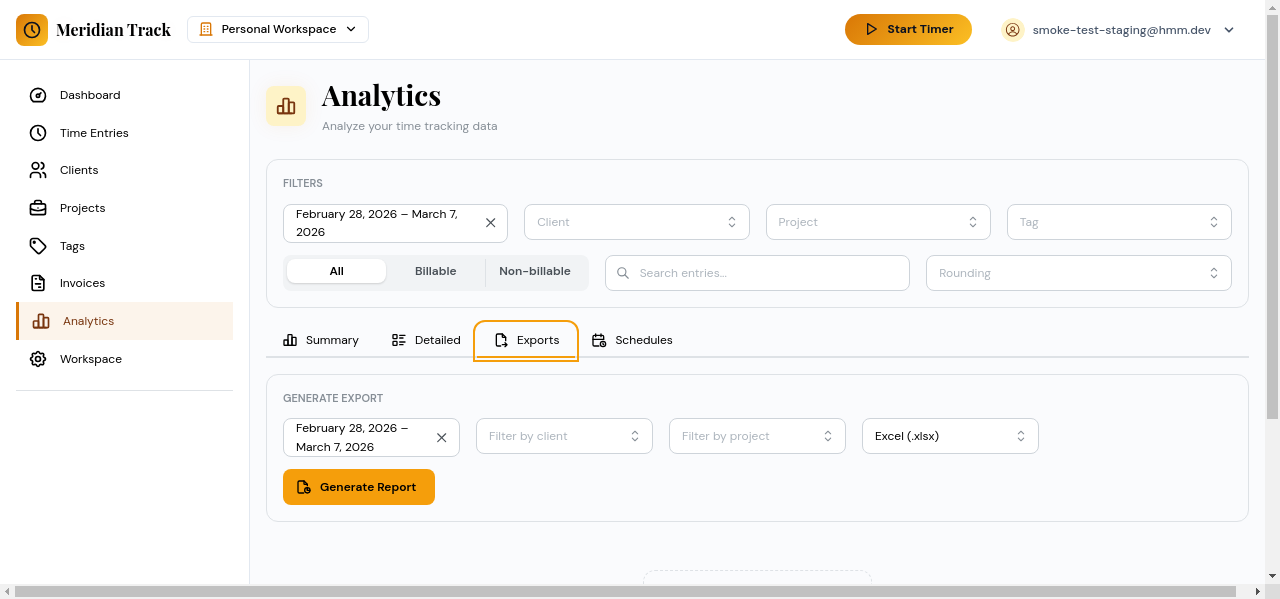
- Configure the report filters (date range, client, project).
- Choose the format: PDF or XLSX.
- Click Generate Report. The report is created in the background.
- When the report is ready, a download link appears. Reports are available for 30 days after generation.
Schedules
Section titled “Schedules”The Schedules tab lets you set up automated recurring reports.
- Click New Schedule.
- Define the report parameters (filters, format).
- Set the recurrence (e.g., weekly on Monday, monthly on the 1st).
- Choose delivery targets (email addresses).
- Save the schedule.
Scheduled reports run automatically and are delivered to the specified recipients. You can edit, pause, or delete schedules at any time.