Dashboard
The dashboard is the first screen you see after logging in. It provides a high-level summary of your tracked time, earnings, and project progress for the current period.
Stats Cards
Section titled “Stats Cards”Four summary cards appear at the top of the dashboard:
- Total Hours — The sum of all tracked hours for the selected period.
- Billable Hours — Hours marked as billable, shown alongside the percentage of total hours that are billable.
- Active Projects — The number of projects with at least one time entry in the selected period.
- Earnings — Estimated earnings calculated from billable hours and their associated hourly rates.
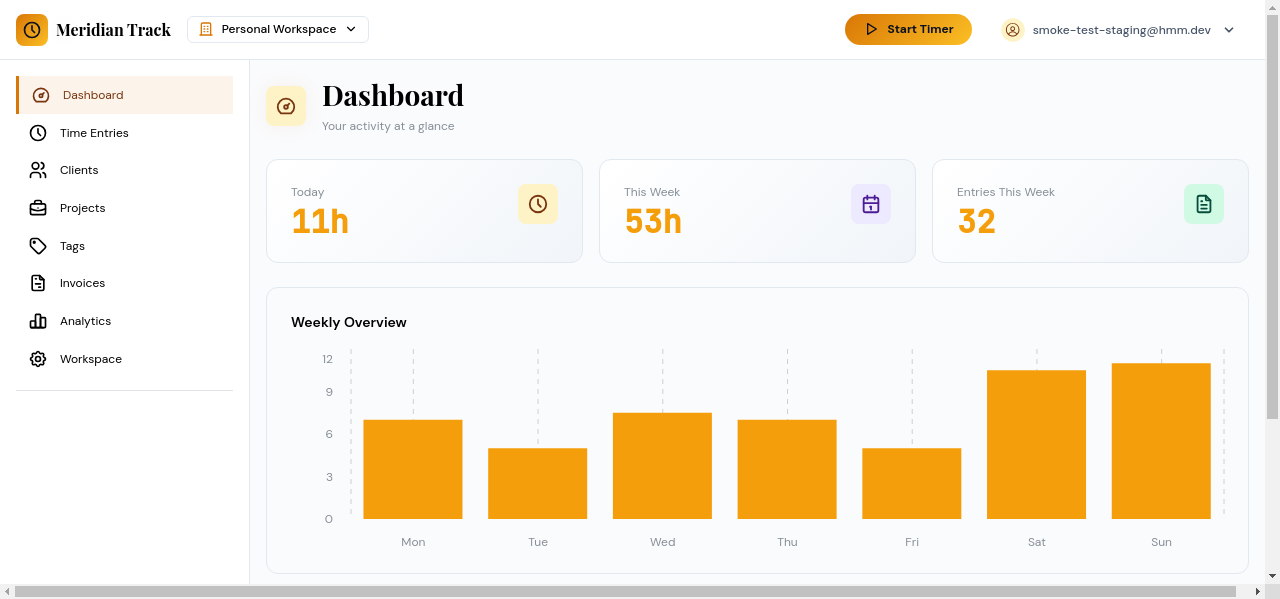
Weekly Hours Chart
Section titled “Weekly Hours Chart”A bar chart displays your tracked hours broken down by day of the week. Each bar represents one day, making it easy to spot patterns in your work schedule and identify days with unusually high or low activity.
Project Budget Progress
Section titled “Project Budget Progress”Below the chart, a list of projects with configured budgets shows progress bars indicating how much of each budget has been consumed. Each entry displays:
- Project name and associated client
- Hours tracked against the budgeted hours
- A visual progress bar with color coding (green for on-track, amber or red as the budget is approached or exceeded)
This section only appears for projects that have a budget configured.
Recent Time Entries
Section titled “Recent Time Entries”A table at the bottom of the dashboard lists your most recent time entries. Each row shows:
- Task name
- Project and client
- Date and duration
- Billable status
Click any entry to open it for editing, or use the link to navigate to the full Time Entries page for more detailed filtering and management.